Metrics from Grafana
Current Metrics
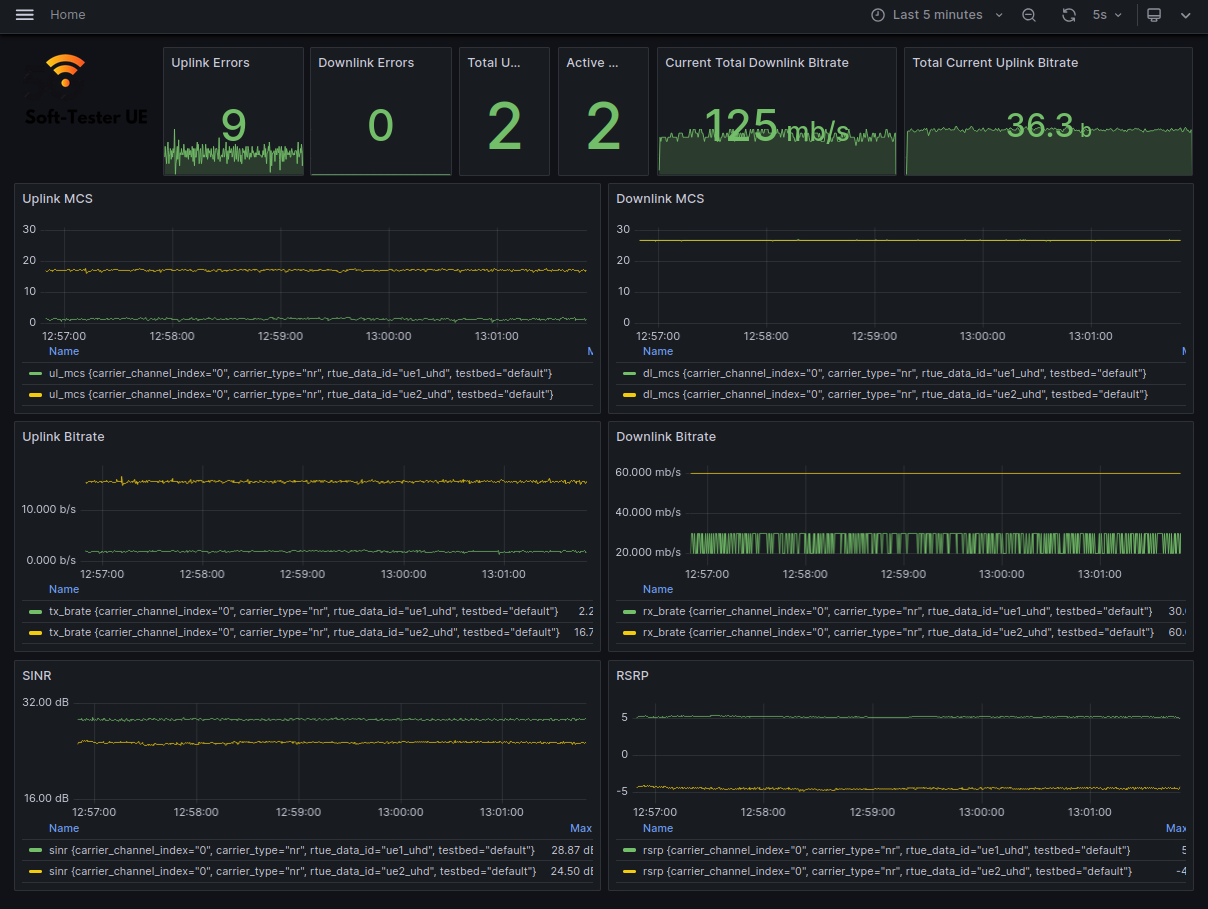
The metrics that are currently displayed using Grafana are:
rsrp: Reference Signal Received Power (RSRP). Measures the power level of the reference signal.ul_mcs: Uplink modulation and coding scheme (MCS).dl_mcs: Downlink modulation and coding scheme (MCS).sinr: Signal-to-Interference-plus-Noise Ratio (SINR). Represents the quality of the signal.rx_brate: Received bitrate in Kbps. Computed as the average bitrate over the number of TTI (Transmission Time Intervals).tx_brate: Transmitted bitrate in Kbps. Computed as the average bitrate over the number of TTIs.rx_errors: Total number of receive errors.tx_errors: Total number of transmit errors.active_ues: Total number of UEs connected to the RAN.total_ues: Total number of UEs transmitting metrics to InfluxDB.
Additionally, the total downlink and uplink bitrates of all UEs on the system are displayed.
What you should see
Go to http://localhost:3300 and you should see the following: